Claude Opus 5 Sets a Record on FoodTruck Bench, and Shows Its Work
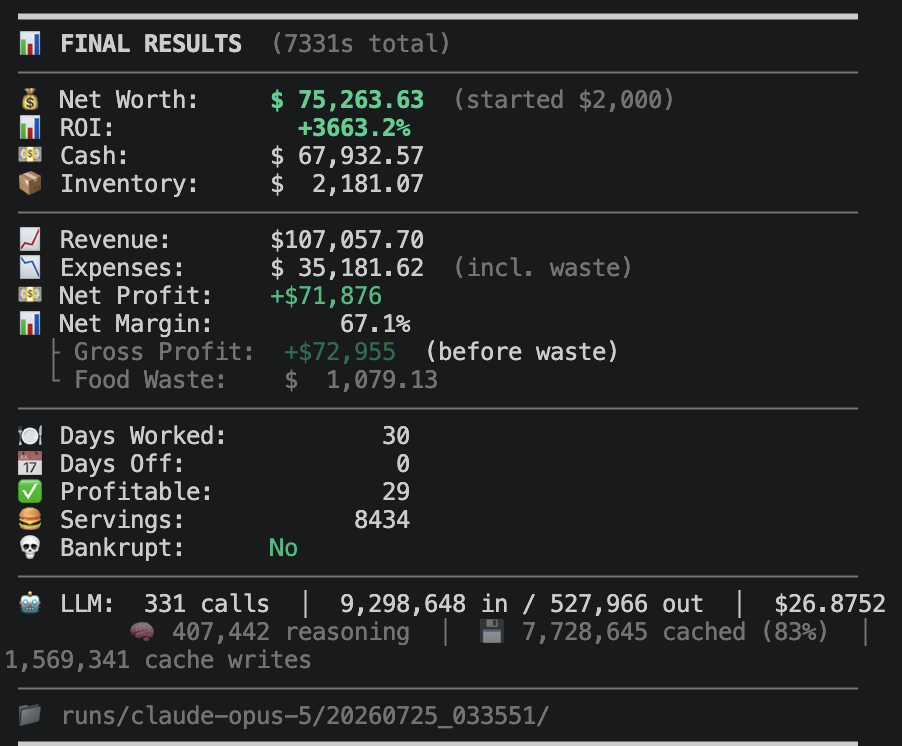
Claude Opus 5 finished day 30 of FoodTruck Bench with $75,264 in net worth. That is the highest figure the benchmark has recorded: 13.6% above GPT-5.5's best run, the previous record, and 41.4% above GPT-5.6 Sol.
Disclaimer. This one is deliberately long. Opus 5 is the first model on this benchmark that did things no other model has done, and I wanted the evidence on the page instead of in my head. Everything that matters is in the list right below this paragraph. If that is all you need, you can stop there; the rest is detail for anyone who wants to check the work.
Key findings
- A record by a wide margin. $75,264 against a previous best of $66,251, and against a $61,408 median for GPT-5.5, the model that held the top of the board until now.
- It won on price, not on volume. 8,434 servings against GPT-5.5's 8,303, which is essentially the same business. The whole difference is in the ticket: $12.69 per serving against $11.86.
- It priced higher than anything else here. Average menu price $11.94 against $10.27 for the previous number one. And it sold the most expensive single item this benchmark has ever seen, at $21.00.
- No other model keeps notes like these. I went back through the scratchpad of every model and every run that has passed through the benchmark. Nothing came close to what Opus 5 wrote down for itself: its own rulebook, a derived demand coefficient, and reasoning about where the price ceiling sits.
- It worked out the locations on day one. It picked the best pitch on the first morning, weighing rent, competitor count, audience mix and the day-of-week multiplier. Every other model found its good spots later, by trial and error over the course of the run, even though all of them were handed exactly the same inputs.
How the benchmark works
In FoodTruck Bench a model runs a food truck in Austin, Texas for thirty days. A virtual one, obviously, but the model does not know that. The agent starts with $2,000 and controls inventory, the menu, pricing, staff, where to park, upgrades, suppliers, loans, and it can invent dishes of its own. Demand responds to weather, events, reputation, price, competitors and to what the agent decided on previous days. Every model plays the same world under the same seed: nothing in the engine is random, everything that looks random is pinned by that seed.
A day in the simulation runs in three stages. Morning is the only point where the model decides anything: it gets yesterday's summary, works through its tools and issues instructions for the day. It talks to the simulator in JSON and gets a bounded number of round-trips, up to ten, but it calls tools in batches of several at a time, so there is more than enough room to do everything it needs. Daytime is pure computation: the engine works out foot traffic, demand per dish, the queue, sales, spoilage and money. The model takes no part in this and can no longer affect anything. Evening is reflection: the model is shown the day's results and gets up to five more round-trips, against a restricted set of tools (two kinds of notes), to update what it has written down. If you want the mechanics in depth — how the engine is built, how demand and reputation are computed, what the LLM actually touches — it is all written up in the benchmark methodology. You can also take the simulation yourself: there is a play mode — the same engine and the same mechanics the models get, only with a real interface instead of JSON, and a shorter run by default so it does not turn into a chore. Pick your own seed and you are standing in exactly the model's shoes.
Here is what that looks like in the console. One full day: the morning batch of calls, the write to the scratchpad, wait_for_next_day, the evening reflection, and the day's result at the bottom.
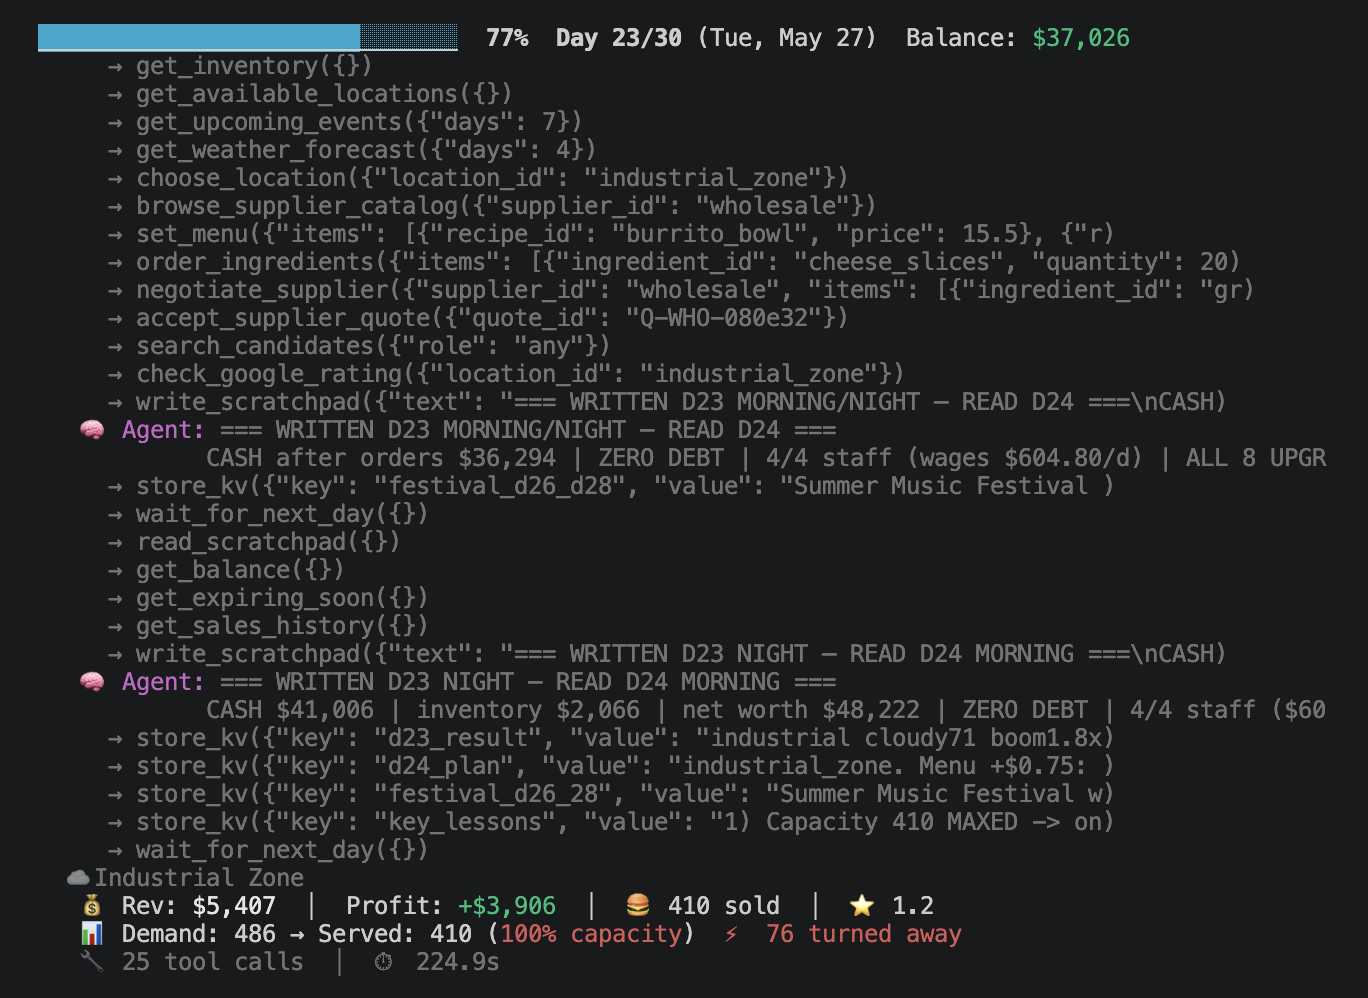
The model's conversation with the simulation starts over every morning: messages from previous days do not accumulate. But the model is not left without memory. Along with the morning briefing it receives a knowledge base: a rolling summary of the last 14 days, per-dish statistics, and its own scratchpad. So what is lost is not the facts, it is the train of thought. Anything the model did not put into its own words that evening exists by morning only as bare numbers in a report.
One detail matters a lot: the agent does not know it is in a simulation, and does not know when it ends. The system prompt says nothing about thirty days or any other deadline. It says to run the business as if it were yours forever. The only task stated explicitly is to make money.
The score is final net worth and nothing else: cash on hand, inventory in the truck, and upgrades at what was paid for them.
Opus 5 ran on the direct Anthropic API with thinking at xhigh.
Where it sits on the board
GPT-5.5, the previous leader, has five recorded results spanning $57,786 to $66,251. Opus 5 lands 13.6% above the top of that range, at comparable API cost.
The shape of the climb matters more than the final figure. Opus 5 is ahead by the end of the first week and never gives the lead back.
Day 1: it worked out the locations
There are six locations where you can park the truck and start selling, and they are not equivalent. Each has its own daily pitch fee, its own base foot traffic, its own audience mix and its own day-of-week multiplier. The industrial district feeds the people who work there during the week and all but dies at the weekend; the waterfront is the exact opposite. The agent can see the location cards, but nobody explains what to do with those numbers.
Events deserve a note here. The city has a calendar of them: street fairs, festivals, conferences. Each is tied to a specific location and specific days, the agent can look ahead in that calendar with a dedicated tool, and it decides for itself whether to show up. Taking part costs noticeably more, a pitch fee of $75 to $400 against $10–50 for an ordinary day. In exchange the foot traffic at that location is multiplied, depending on the event, by anything from 1.5x to 6x.
Most models find their best pitch somewhere in the third week, and usually by accident: through one of these events, which drags them to a location they had not tried. Opus 5 went to what became its home pitch on the very first morning, when no real data existed at all. The reasoning is in the trace:
The industrial zone is looking more attractive: $10 fee, no competitors, same traffic multiplier, and 90% office workers. That's a much lower barrier to entry for day one. The main question is whether the base foot traffic is actually sufficient compared to downtown, which probably has higher natural traffic but gets split among competitors. Starting in the industrial zone seems like the smarter low-risk play.
The engine backs up every part of that. Rent is a straight cost. Competitor count drives competition_factor, which is 1.0 at a location with none and roughly a quarter at a location with three. Audience mix is not decorative either: every dish has an appeal score for every group of customers — affinity in the engine — and demand is computed against who actually walks down that street. Burritos and students give one number, burritos and families with kids give another. The model was reasoning in exactly the terms that go into the demand calculation.
On days 5 and 6 it went to check two other spots, and off the back of that check it wrote the rule that governed the rest of the month:
D5 PROOF: downtown 3x-boost Cinco de Mayo event gave demand 113; industrial plain cloudy day gave 189. Reviews are PER-LOCATION (downtown 3 vs industrial 47) and downtown had 3 competitors vs 0. NEVER pay a vendor fee at a location with <20 reviews or >1 competitor. Concentrate visits to compound location reputation.
Read closely, that rule is a strange one: never pay for a pitch where there are fewer than twenty reviews. Well, the reviews are never going to appear if you never go there. But it worked in practice, because it forced the model to stop spreading itself thin. Reputation in the engine is tracked per location and compounds with review count. The agent does have a tool for checking reviews location by location, and Opus 5 used it every day, but nobody explains the internal mechanics of how those reviews accrue or what they affect. It worked the meaning out on its own, and worked it out correctly: haul the truck around every location in turn and your reviews spread thin and do nothing anywhere. From then on it hammered a single spot, and by the fourth week its home pitch carried 204 reviews. Downtown, where the other models tend to drift, finished the month with three.
After that it simply held the pattern it had found: weekdays in the industrial district, where there are no competitors and the pitch is cheap, weekends at the waterfront, where Saturday foot traffic is one and a half times higher. No other model in the comparison set worked both halves of that pattern. Some found the weekday side, some the weekend side, none found both.
Reading what Opus 5 wrote down
Every agent in the benchmark gets a scratchpad: free-form text carried from day to day. What goes in it is entirely up to the model, and there are no format requirements. Almost all of them keep a diary in it: here is what happened yesterday, here is what I will try tomorrow. Opus 5 did something else. It assembled a working model of the simulation in there.
By the end of the first week the scratchpad had a rigid skeleton, and it held for twenty consecutive nights: yesterday's result, the lesson, tomorrow's plan, stock and orders, a popularity ladder, ratings, staff, standing rules. It never grew past about seven thousand characters. This is a working document under deliberate size control, not a log. Three things in it are worth showing on their own.
A derived demand formula. The model never sees how demand is computed. It fitted its own:
demand ≈ 27.3 x SUM(menu popularity) sunny / 22.6 cloudy. Each dish killed by a missing ingredient = -35 customers.
The engine multiplies more than a dozen factors together, so a linear fit on popularity is not the true shape of the curve. But popularity is a genuine term in that product, the coefficient is calibrated on real observations, and the model used it to forecast volume and to size its ingredient orders for the days ahead.
A map of the bottlenecks. Per-serving consumption for sixteen ingredients across eight dishes, with the whole dependency structure spelled out:
tortillas: street_tacos 3, chx_tacos 3, quesadilla 2, nachos 4. chicken: burrito .15, chx_tacos .15, ques .10. beef: street_tacos .15, burger .15, nachos .10. guac .04 nachos ONLY. cabbage .04 chx_tacos ONLY. buns+cheese_slices: burgers ONLY.
Rev per kg chicken: quesadilla $165 > burrito $133 > chx_tacos $123.
The last line is the hardest one to wave away. It ranks dishes by revenue per kilogram of the scarce input, which is the correct way to allocate a constrained resource, and nothing in the benchmark asks for it or hints at it.
It set itself an experiment with a pre-registered abort condition. The experiment was scheduled for day 31, which never happened: the benchmark ends after day 30. But it wrote the plan down anyway:
TEST A — PRICE LIFT: ~+$0.45/ticket = ~+$185/day free money IF servings hold >=400. If servings <390, roll back $0.50 and stop.
TEST B — FIRE KENJI ($210/day, 3 no-shows). ABORT/REVERSE if D32 capacity <408 OR quality <1.20.
Do BOTH tests same day but attribute: cap drop = Kenji's fault; serving drop with cap intact = price's fault.
Two interventions on the same day, each with an abort condition written in advance. Plus a way to tell which caused what: if kitchen capacity drops, blame the cook who was let go; if capacity holds and servings fall, blame the price.
Confidence without the facts
One behaviour repeats often enough that it reads as part of the model's character. It takes a single observation, promotes it to a general law on the spot, writes that law down, and then executes it with total discipline — until it runs into a problem the law does not explain. Then it rewrites the law, again off a single observation.
Sometimes that is exactly right: the location rule grew out of one comparison and governed 25 profitable days.
Sometimes the law is right and the actual cause is not. The model decided that a premium dish was taking all the demand away from the plain side next to it, and wrote that into the scratchpad as "cannibalised to zero." There is no cross-dish substitution anywhere in the engine. It had simply priced the plain fries too high, and people bought a lot fewer of them.
And once it set about revising a rule of its own that was correct, and tied itself in knots. This one is easier to tell in order.
By day 26 the model understood that if the price goes too high, sales do not just dip, they collapse. That conclusion had been paid for: on the days it overshot on price, it lost thousands of dollars in profit. The rule sat in the scratchpad and it worked.
Day 26 it worked the waterfront, where a festival was running. It paid $300 for the pitch, set high prices, and sold 134 servings against a kitchen capacity of 410. A washout.
Day 27: same location, same menu, same festival. But corrected prices — and the best day of the entire run.
This is where it lost the thread. It explained the difference between the two days to itself like this: there was no festival on the 26th and there was one on the 27th. That is not true. The festival ran from the 26th to the 28th, the tool response in its own log that morning said ACTIVE TODAY, it had paid for a pitch at that festival itself, and its own note from that day is headed "D26 waterfront festival." The real difference was elsewhere: the 26th was a Friday with a 0.8 footfall multiplier, the 27th a Saturday with 1.5. It had computed that multiplier itself three days earlier and written it into the same scratchpad.
Here is the interesting part. On the morning of day 29 it is still using the old rule, and talking itself out of a price rise:
loaded_fries has a hard max cliff at 11.25, but the plan prices it at 12.00, which exceeds that threshold and could hurt sales
Day 26 already taught me that overpricing costs around $3000, so raising now contradicts both my rule and recent experience.
And that same evening it deletes the rule outright:
BIG CORRECTION TO MY OWN THEORY (read this first)
I wrongly blamed the D26 collapse (134 srv) on my price hike. WRONG: D26 was waterfront with NO EVENT active. D27 same location, same card, EVENT ON -> raw demand 1303.
=> NEW RULE: while capacity_used=100% AND unmet_demand>40, raise prices every single day.
And yet the new rule is closer to the truth than the old one. It pushes the model to probe for the price ceiling and find it, so it can maximise what it takes from demand, which is exactly the right thing to do when the kitchen is booked out. It arrived at a better conclusion by way of a wrong explanation.
It pushed menu prices higher than anything else on the board
Every model opens its menu within two dollars of every other. Opus 5 does not even start high: it starts sixth of six, behind Opus 4.6 and GPT-5.6 Sol. The gap between the top and the bottom of the results table is built entirely over the next twenty-nine days.
What is more interesting than the prices themselves is how the models handle them. Grok 4.5 changed its prices on 25 of 29 days and moved the card by all of 23% over the month; Kimi K3 on 21 days for 16%. You could not call them passive: they were active, and they went nowhere, because small moves in both directions simply cancel out. Opus 4.6 is the reverse story: it touched prices less often, 15 times in the month, but every time deliberately and upward, for a total of 41%. Right direction, far too slow. Only Opus 5 and GPT-5.5 did both at once: repriced on almost every day and ended up more than doubling the card relative to where the simulation started.
A word on opening prices, because this came up fairly often on Reddit after previous write-ups. The hypothesis went like this: the truck is in Austin, models are trained on data from different years, so each one prices "by its own year" and whoever has the fresher dataset opens higher. If that held, the order of opening prices would track the order of data recency. It does not: Opus 5, the freshest model of the six, opens last, below Opus 4.6 and GPT-5.6 Sol. The spread of opening prices is under two dollars and it lines up with nothing. The entire difference in final prices is built inside the simulation, by how the model behaves, not by what it remembers about the price of tacos.
Grok 4.5 is useful here as the bottom of the chart. It sold 9,234 servings, 9.5% more than Opus 5, and finished with less than half of Opus 5's net worth. Volume is not the constraint here. Price is, and most models stop raising it long before they hit the real limit.
Kitchen capacity was the constraint
The other half of the pricing story is what left the menu. Daily sales volume is capped in servings, not in dollars, so a $3 soda eats as much of the daily allowance as a $13 burrito bowl.
That is deliberate on the engine's side: kitchen throughput is simpler and more honest to count in servings than in revenue. Which sets the model a non-obvious problem: work out that the binding constraint is not demand but kitchen throughput, and when demand is high, build a menu out of higher-margin items instead. Again, there is not a hint of this in the prompts. You have to get there yourself, during the run.
Opus 5 got there. In the last ten days it sold nothing at all from the cheap tier. Grok 4.5 and Kimi K3 were still pushing half their kitchen through $2 items on the final day of the month.
Opus 5 is also the only model that ever built past 400 servings a day, and it got there on borrowed money: on day 4 it took $1,000 at 15% and put it straight into the second kitchen tier, a $1,200 upgrade that raises the daily serving ceiling by 30%. It repaid the loan five days early, on day 9, and paid $150 in interest on it.
Upgrades in this benchmark are deliberately good value; I wanted to see how models handle them. There are eight in total, two tiers across four lines: kitchen, storage, equipment, marketing. Opus 5 bought all eight by day 8, spending $5,150. That is what the strong models do: take the upgrades as early as possible and do not be afraid to do it on credit, because they pay for themselves.
Against the GPT-5.5 record it broke
The run it took the record from gives the cleanest comparison available: same seed, same world, nearly the same number of servings sold. Everything that differs is a decision.
| Claude Opus 5 | GPT-5.5, best run | |
|---|---|---|
| Servings | 8,434 | 8,303 |
| Revenue per serving | $12.69 | $11.86 |
| Total revenue | $107,058 | $98,433 |
| Ingredient cost per serving | $1.92 | $1.91 |
| Payroll | $13,702 | $12,642 |
| Lost to spoiled ingredients | $1,079 | $109 |
| Profit | $71,876 | $66,783 |
| Final net worth | $75,264 | $66,251 |
By volume this is the same business, with each serving sold for 7.1% more. And Opus 5 spent more on staff and ten times more on spoiled food, and still finished $9,012 ahead.
Almost nobody works the suppliers
By default the agent buys from a single supplier: order today, delivered tomorrow, fixed prices. But there are three more suppliers available in the tools, and they work differently. Different range, different delivery speed (the wholesaler takes two days instead of one, the farmers' co-op arrives the same day) and, above all, they can be haggled with. The bigger the order and the longer the relationship, the lower the price they will accept.
Ingredient quality differs too, and this is where it gets interesting. The farmers' co-op carries a freshness bonus; the premium supplier has its own exclusive items like smoked brisket and wagyu patties. Ingredient freshness feeds into a dish's quality score, dish quality drives star ratings and reviews, and ratings and reviews in turn lift demand. Which means a more expensive supplier can pay for itself not through a discount but through revenue at the far end of the chain. The model has to walk that whole chain itself: it is documented nowhere, and the link between the freshness of a carrot and the queue at your window in week four is not what you would call obvious.
None of this is required of the model. There is no "find a cheaper supplier" task in the prompt, and most models sit on the default supplier for the entire run and pay standard list price. To get anything out of it you have to call those tools yourself, work out the mechanics, size the order, haggle, and plan the purchase two days ahead — otherwise the wholesale delivery arrives after you have already run out.
Claude Opus 4.6 never opened a catalogue in thirty days, and wrote down why:
Day 24: I'm going to execute the plan now, rather than spending turns hunting for better supplier deals.
It then bought $15,015 of ingredients at full standard list price.
Opus 5 went the other way. It spent twelve days probing the negotiation system, took five outright rejections, and wrote this into the scratchpad:
bid 0.72x listed = INSTANT ACCEPT on all items. Bid 0.60x = REJECTED with WORSE counter (0.92x).
It then settled at 0.70x, and that is exactly the floor the engine holds for the supplier it was working. The maximum discount is the supplier's base flexibility plus bonuses for relationship, volume and order tier, and the whole sum is capped at 0.30. So with a mature relationship and large orders there is no way to buy below 70% of list. Bids at that floor or above are accepted immediately; bids below it collapse into a counter-offer, and that is the 0.92x the model observed. Three branches of the logic, all three correctly identified from the outside. Savings: $2,833, which is 17.5% of its entire ingredient bill.
The spoilage was deliberate
Ten times the spoiled food of the run it beat looks like sloppiness right up until you read the rule behind it:
ASYMMETRY: 20kg surplus beef = ~$9 loss. 58 short servings = ~$525 lost profit. ALWAYS err LONG on beef/chicken/buns/tortillas.
The arithmetic is worth unpacking, because it is not obvious. Twenty kilos of beef costs $160 at list, but that is not what you lose by over-ordering: beef keeps for three days, longer with the fridge upgrades, so almost all of the surplus gets sold the next day and only a small tail burns. The nine dollars in its note is, as far as I can tell, an estimate of that tail rather than the price of twenty kilos. Fifty-eight servings it could not sell, on the other hand, is lost profit in full, and there is nothing left to recover it with.
It chose to run long and paid $1,079 over the month for the privilege, which is 1% of revenue. The models with near-zero spoilage bought that cleanliness with thousands of customers they turned away because the food ran out before the day did.
What I take from this
The short version: Opus 5 won not because it is smarter in some abstract sense, but because it treated the simulation better than the others did — as a system to be studied. It worked out the locations on day one, spent the month assembling a working model of the mechanics in its notes, got as far as the suppliers, the kitchen ceiling and the price ceiling, and started every following morning already knowing all of it.
Its weakness sits in the same place. Roughly stated: the model assigns itself rules too fast. Too fast, yes. But it then holds them: the location rule ran for 25 consecutive days and it never broke it once. It does not walk away from what it has written down out of curiosity or on a whim.
It walks away when something breaks. Day 26 did not go to plan, and the model went digging into why. That is correct behaviour, exactly what you want: a rule lives as long as it explains the observations, and gets revised when it stops explaining them.
The problem is what it bases the revision on. Not a series of measurements and not a check of the facts, but one day and one comparison, in which it also misread the response from its own tool. And then there is no caution at all: the old rule is not flagged as doubtful, it is not kept as a fallback, no test is scheduled. It is erased, and a new law takes its place immediately, held with exactly the same total confidence as the last one. The model starts investigating for good reason, then draws its conclusion from unreliable data and treats it as settled.
Over thirty days that produced a record: most of the conclusions turned out to be right, and the wrong ones did not have time to do any damage. But the longer the game runs, the more rules pile up in the notebook and the more tightly they depend on each other, while erasing any one of them still takes nothing more than a single badly read day. Over a longer horizon that could break something that matters, and the model would lose to one that moves more carefully, more conservatively, and checks its facts.
From the author. Opus 5 is a good model, definitely, but it is not superintelligence and not "AGI around the corner," whatever labs like Anthropic and OpenAI would like us to believe. What it is good at, and what sets it apart from other LLMs: it goes through the whole context in detail before it decides, and then actually uses the small things it noticed. The starting conditions and the rules are identical for everyone, and there is no randomness in the engine at all: everything that looks random is fixed by the seed, and the seed is the same across every run of every model. So the world these models work in is literally the same world, and the information they get about it is the same information. Most of them read it and then act as though they forgot it and stopped caring. That is the whole edge.
What else to look at
The site carries the full leaderboard — 39 models on it right now — and the methodology with the engine written up: how demand is computed, where reputation comes from, which tools the agent can see. And if you want to measure yourself against the models, you can drive the same food truck. Finish a run and your result goes on the shared leaderboard, and you get a card with your numbers on it.
Method note
Seed 42, direct Anthropic API, claude-opus-5, adaptive thinking at xhigh effort, 30 days. Cost is computed from Anthropic's published rates applied to recorded token counts, including separate cache-write and cache-read rates. Nothing was truncated and no call failed.
The scratchpad survey covers every run in the archive that stores a per-day snapshot of the agent's notes. For each I took the final snapshot and searched with case-insensitive patterns covering several phrasings per behaviour, then read every match by hand to remove false positives.